By now, all of you are probably familiar with the idea of the Google sandbox. The theory behind it is easy to understand, but how many times have you seen real world examples of it illustrated on the Web?
Over the last month or so, this site has crept out of the sandbox and moved into the utopia that is the “land of the trusted domains.” The results have been, in my opinion, nothing short of remarkable.
Because I think an in-depth look at the effects of emerging from the sandbox will interest many of you out there, I decided to conduct a simple analysis that illustrates what a stifling obstacle the Google sandbox really is!
Take a Look at My Sandbox
As you accrue content on your Web site, you provide more and more avenues for people to access your material via Google. But, if your site’s pages are not counted among Google’s trusted ranks, then your chances of having someone access your content via search are about as good as your chances of winning the lottery.
The interesting thing about the trusted ranks, though, is that your site actually joins them one page at a time — it’s not just an all-in process. The longer pages exist and the more traffic and links they receive, the more likely they are to eventually join the trusted ranks.
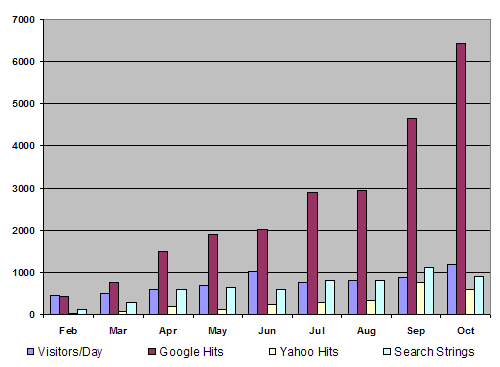
The following graph (Figure 1) illustrates how this process plays out over time:

Figure 1. Monthly hits from search engines and the total number of search strings used to access this site (October numbers are incomplete).
Despite its relative simplicity, the above graph actually contains some very revealing details about the Google sandbox. Among these details:
- Google performed its “quarterly” index (where it assigns new page rank and includes/excludes more pages from its trusted ranks) in late February, late June, and late September. Notice how after each new index, this site saw a corresponding jump in monthly hits from Google and also in the total number of search strings that were used to access the content.
- Through June, nearly all of my Google traffic came to only five pages of this site, despite the fact that I actually had over 90 total pages. On top of that, search strings that successfully landed visitors on my site were incredibly specific.
- By the end of August, just over 20 total pages were indexed in Google, and the overall number of Google hits evidence the fact that there was more meat out there for searchers to chew on. On top of that, I began to see more permutations of each search term showing up, which stands in direct contrast with the specificity I experienced through June.
- Although we’re not even halfway through October, it looks as though nearly all of my 113 pages (currently) are not only indexed in Google, but they’re also out there sending a significant amount of traffic back to this site. Oh, and as for the search strings that are getting people here? With terms like “horse face,” “bitch slap,” “hulkamania,” “ugly woman,” and “god warrior” landing people on my finest pages, it’s starting to look like a bit like a circus :)
A Graphical Depiction of Rising Trust
Clearly illustrating the concept of Google trust is somewhat of a vague ambition. While I’m certainly not going to claim that I’ve come up with anything novel here, I have managed to put together a graph that I think provides at least one view of how pages rise in the SERPs over time as they accumulate trust.
To illustrate the concept of Google trust, I chose to look at the frequency with which my top 20 search strings landed people on the pages of my site. In my opinion, if a search term consistently results in a successful visit to this site, then you can reasonably conclude that the landing page is also probably enjoying a higher position in the SERPs for that particular search string.
To put it another way, if you rank on page 5 for a term, you might see a couple of hits a month. By contrast, if you rank on page 1 for that same term, you might see hundreds of hits a month. In theory, page 1 results are more “trusted” than those on page 5…

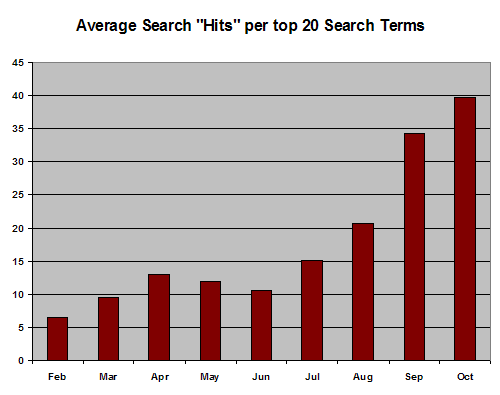
Figure 2. Average number of hits on my top 20 search terms by month (October numbers are incomplete).
In the Figure 1 analysis above, I explained how more and more of this site’s pages became indexed as Google performed its quarterly updates. With each successive update, I noticed more and more search terms driving people back to my site.
Figure 2 is basically Figure 1 from a slightly different angle, as it shows the frequency with which particular search terms resulted in visits to this site. Of particular note here is how the frequency has risen dramatically with each quarterly update.
While the total number of search strings (shown in Figure 1) is evidence of the fact that more content has been indexed in Google, I believe that the frequency of a particular search string (shown in Figure 2) is a great indicator of just how “trusted” certain pages of your site have become.
Although the October numbers are incomplete, I project that once all is said and done, I will see an average of 75 hits for my top 20 search terms.
Based on my those numbers, then, I can only conclude that I have, in fact, reached “trusted” status within Google.
The Bottom Line
It really is amazing how powerful Google is in terms of pushing traffic all over the Web. I’ve been amazed by the rate at which my traffic and other metrics have increased over the last two months, which is basically the time frame since I crawled out of the Google sandbox.
In fact, now that I’m out (and a geek), I can say that getting out of the sandbox is kinda like getting laid for the first time.
It’s a phenomenal process to behold, and it’s both impressive and intriguing how much Google can shift the traffic dynamics of a Web site once it’s fully-indexed.
Now, imagine the possibilities if you were actually selling something off of all these indexed pages…
It’s a shame I hate retail so much :)