 Ever wonder how much your readers appreciate what you have to say? If you’re like me, then sometimes you’re a little disappointed at the lack of comments or other tangible evidence that screams “we like you…we really like you.” Naturally, you may begin to wonder if anybody really cares what you have to say.
Now, I’m not overly worried that people are going to run off and never come back to this site, but I was certainly curious to find out more about audience behavior. With that in mind, I took a look at my metrics, and I was actually pleasantly surprised by what I found. By applying some very simple mathematics to visitor data (and using some common sense – what, that’s big for me!), I came up with a way for you to loosely determine how focused your traffic is on what you have to say.
Collect the appropriate data
To begin, you’ll need to access the following data:
- Total number of visitors for the month – Please note that this is not “hits;” it’s sometimes referred to as “uniques,” and it’s a rough indicator of how many people have visited your site. Yes, I understand that your visitors are recounted daily, so the total number of different visitors may only be 500. Those 500 may come back every day to make up your total visitors stat, but that’s ok – we’ll account for that using common sense :)
- Search string information – Most metrics packages include summaries of which search engine terms are driving traffic to your site, and you can use the associated numerical data to get an idea for how much of your traffic arrives by happenstance.
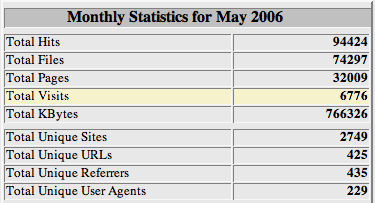
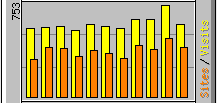
If you’re using Webalizer to get your stats, then you’re in luck, because the following graphs show you exactly what you need to know:


The highlighted areas of the images indicate the data you’ll need.
If you’re using a different program to get information about your site traffic, you’re on your own. The good news here is it’s relatively easy to decipher most metrics packages, so you shouldn’t have any trouble.
Let’s crunch some numbers!
Alright, now that you’ve (hopefully) got your metrics, let’s think about this for a second. Realistically speaking, there are three types of traffic:
- Search engine referral traffic – If we’re talking about readership and enjoyment, then this is the absolute weakest type of traffic. Generally speaking, people who arrive at your site via these means are looking for something specific, and if you can’t offer it to them in a fraction of a second, then they’re gone with the wind, baby.
- Inbound link traffic – Typically, traffic of this kind arrives at your site with their interest already piqued, so you stand a little better chance of retaining this type of visitor for at least a full second :) Be that as it may, I don’t think you can reasonably establish a correlation between visitors like this and a general “love” for your site.
- People who come directly to your site because they enjoy coming to your site – It’s no mistake when somebody types in pearsonified.com and hits enter. They’re coming here because they want to see what I have to say, and the same certainly holds true for your site as well.
Since I can’t think of a better way to determine “love” from site metrics, we’re going to assume that people who arrive to your site via feed aggregators and direct requests (like typing “pearsonified.com”) are the ones who love ya. They’re there because they want to be there, and that sure smells like love to me!
Without further ado, here’s our example:
![]() Thanks to the data that you’ve already acquired, we now have a few given conditions. Based on the first graphic, I can see that I’ve had 6776 visitors so far this month. Now, check out your search string numbers. In the snapshot at right, it shows that 31 hits make up 7.45% of the total number of searches that drove traffic to my site. The number that we don’t currently have (but need to find out) is the total number of searches, so we’ll use these values to compute that. Here’s the equation:
Thanks to the data that you’ve already acquired, we now have a few given conditions. Based on the first graphic, I can see that I’ve had 6776 visitors so far this month. Now, check out your search string numbers. In the snapshot at right, it shows that 31 hits make up 7.45% of the total number of searches that drove traffic to my site. The number that we don’t currently have (but need to find out) is the total number of searches, so we’ll use these values to compute that. Here’s the equation:
total searches = number of hits / % of searches
Now let’s plug in the numbers:
total searches = 31 / 0.0745
total searches = 416.11
Based on those results, we’ll say that I’ve had roughly 416 visits from searches so far this month. Once you get over the fact that I have such a freakin miniscule percentage of my traffic coming from search engines, consider this: that’s only 6.14% of my total visitors so far this month!
Kinda makes me think there might be some love there, as this means that 93.86% of my traffic comes from inbound links or direct requests.
At the time of writing, Technorati says that I have 452 inbound links from 197 sites, and theoretically, these links could provide me with quite a bit of traffic each day. One thing to consider, though, is that most of those links are outdated and buried in the archives of people’s blogs, and as a result, there is an extremely low probability that those links will send this site any traffic whatsoever. Therefore, I will contend that of this 93.86% of “intentional” traffic, a vast majority are regular readers who probably actually care what I have to say.
For people with even fewer inbound links than I have, I would argue that the correlation between “readership love” and the percentage of traffic that comes from inbound links and direct requests is probably even stronger.
 If this isn’t good enough for ya, I have another metric that I think helps to prove my case. My posting frequency has dropped dramatically over the last three weeks, but I’ve seen almost no reduction in overall traffic. The only explanation for this is that I have acquired a steady base of people who intentionally come here to see what’s new. If I can go without posting but still maintain reasonable traffic numbers that are not search engine dependent, then I think it’s fair to say that there’s a little bit of love goin on here!
I’ll be interested to see what kind of conclusions the rest of you come up with regarding this topic…